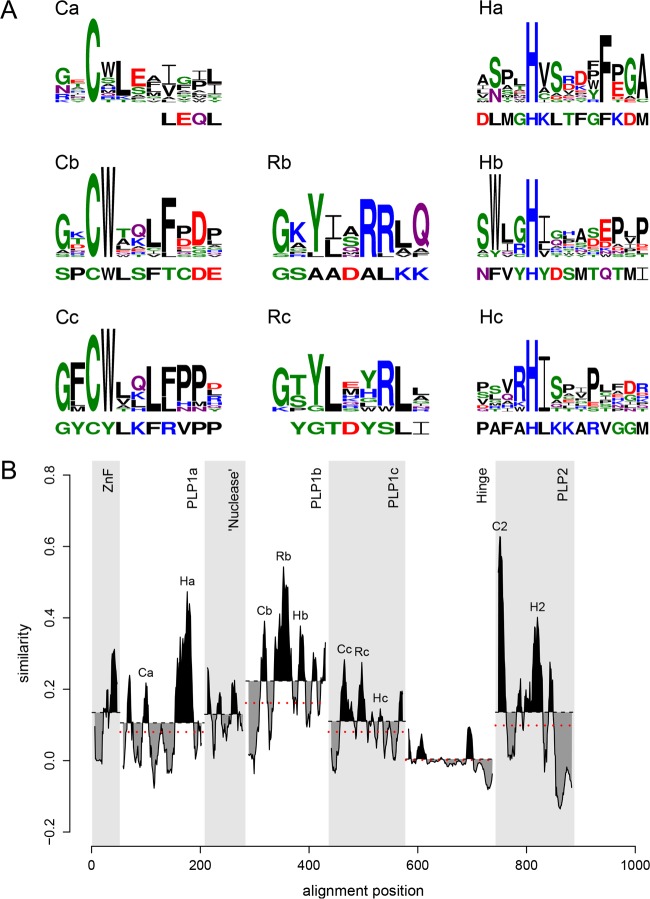
FIG 10.
Distribution of sequence conservation in the N-terminal region of pp1ab of arteriviruses. (A) MSAs of nsp1 PLP motifs of all non-WPDV arteriviruses are depicted as logos, with the homologous WPDV sequence specified below each logo. PLP motifs, including the catalytic residues Cys (C) and His (H) and putative RNA-binding residues (R), are labeled with domain-specific suffixes. Logos were prepared with the R package RWebLogo 1.0.3 (83). (B) The conservation profile, calculated based on the MSA of sequences from non-WPDV clusters, is shown for each domain of nsp1 and the N-terminal domains of nsp2. Areas above and below the mean conservation lines are shaded in black and gray, respectively. Dotted red lines indicate the mean conservation of the domains after the addition of the WPDV sequence to the MSA. EAV PLP1b was regarded as PLP1c for this figure.

