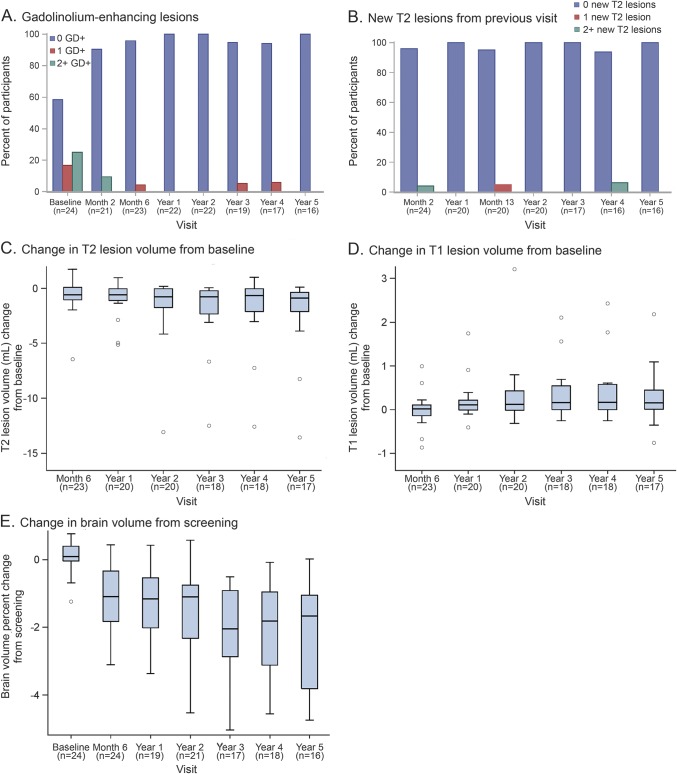
Figure 4. MRI studies.
(A) New gadolinium-enhancing (GD+) lesions occurring after transplant. The GD + lesions as seen at years 3 and 4 are 2 different GD+ lesions observed in the same participant, and thus this individual met primary endpoint. (B) New T2 lesions since previous visit. The new T2 lesions seen at year 4 are in one individual, who met primary endpoint. (C) T2 lesion volume (mL) change from baseline. There was a decrease in T2 lesion volume at year 5 (p < 0.001). (D) T1 lesion volume (mL) change from baseline. There was an increase in T1 lesion volume at year 5 (p = 0.015). (E) Percentage of change in brain volume from screening. At year 5, brain volume was significantly decreased compared to baseline (p < 0.001); however, there was stabilization in brain volume from year 3 to 5 (p = 0.311) after transplant.

