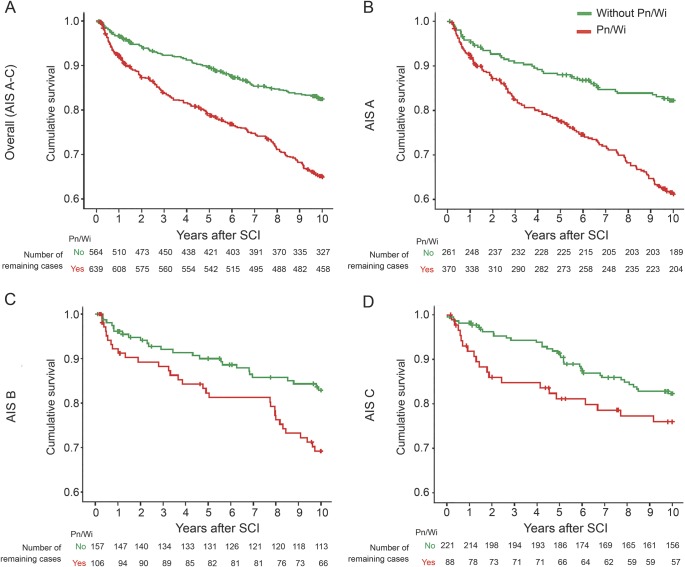
Figure 3. Infection-associated mortality.
Kaplan-Meier curves indicate an increased cumulative mortality for patients with pneumonia or postoperative wound infection (Pn/Wi) in the overall population (A) and subsequent stratification for injury severity (B–D) during the 5-year follow-up. Sample size: number of events of death, number of patients. (A) Total sample (American Spinal Cord Injury Association impairment scale [AIS] A–C): n = 294, n = 1,203; (B) AIS A: n = 182, n = 631; (C) AIS B: n = 56, n = 263; (D) AIS C: n = 56, n = 309. SCI = spinal cord injury.

