
Figure 3.
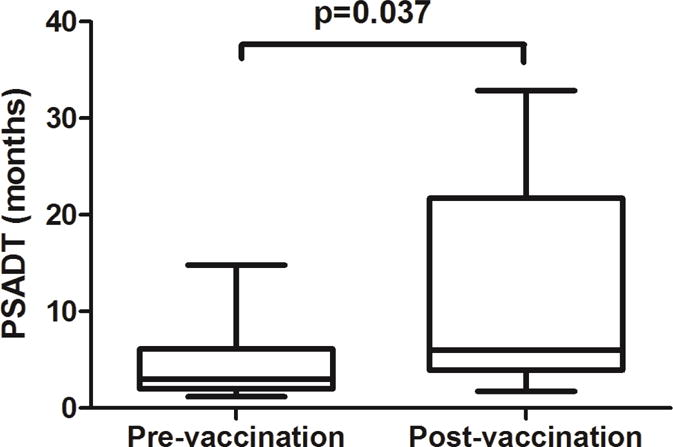
Box and whiskers plot of PSADT calculated for each patient at pre-vaccination and post-vaccination period comprising the first 200 days following the first immunization. Data represent the mean and range for the 16 patients. The mean PSADT during the on-study vaccination period is significantly increased compared to the pre-vaccination period (p=0.037, unpaired Student t-test).