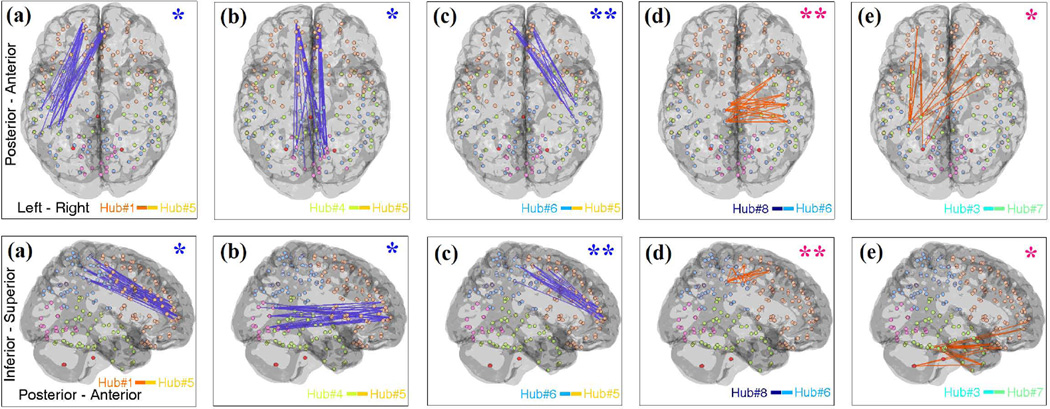
Fig. 2.
The five inter-connectivity (between-hub) patterns with significant group difference between ASD and TDC (axial and sagittal view). Blue and orange interconnectivity networks have higher weights in TDC and ASD, respectively. p < 0.05 and p < 0.01 are labelled with one and two stars, respectively.

