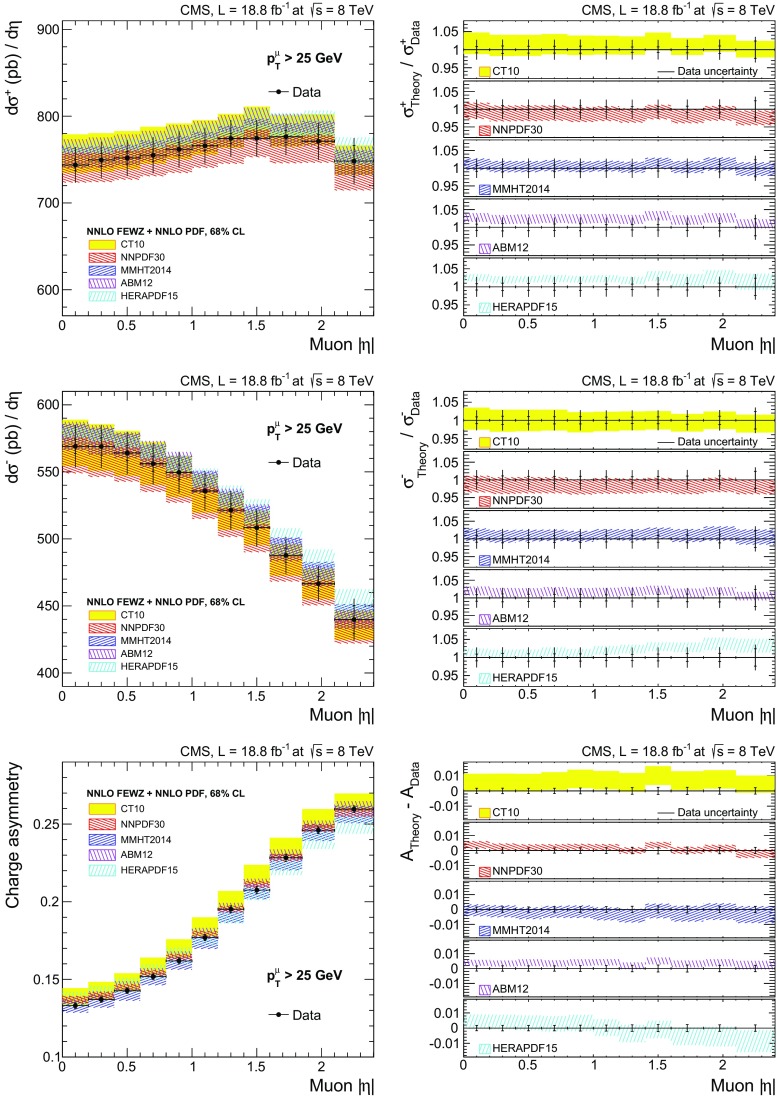
Fig. 3.
Comparison of the measured cross sections (upper plot for and middle for ) and asymmetries (lower plot) to NNLO predictions calculated using the fewz 3.1 MC tool interfaced with different PDF sets. The right column shows the ratios (differences) between the theoretical predictions and the measured cross sections (asymmetries). The smaller vertical error bars on the data points represent the statistical and systematic uncertainties. The full error bars include the integrated luminosity uncertainty. The PDF uncertainty of each PDF set is shown by a shaded (or hatched) band and corresponds to 68 % CL

