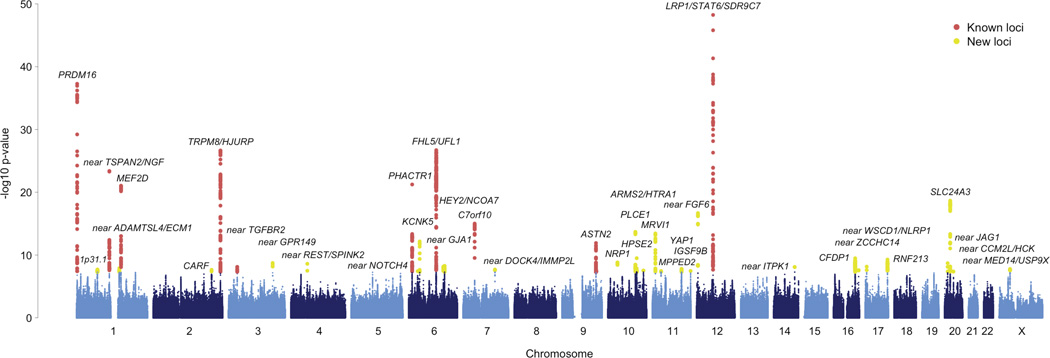
Figure 1.
Manhattan plot of the primary meta-analysis of all migraine (59,674 cases vs. 316,078 controls). Each marker was tested for association using an additive genetic model by logistic regression adjusted for sex. A fixed-effects meta-analysis was then used to combine the association statistics from all 22 clinic and population-based studies. The horizontal axis shows the chromosomal position and the vertical axis shows the significance of tested markers from logistic regression. Markers that reach genome-wide significance (P < 5 × 10⁻⁸) at previously known and newly identified loci are highlighted according to the color legend.

