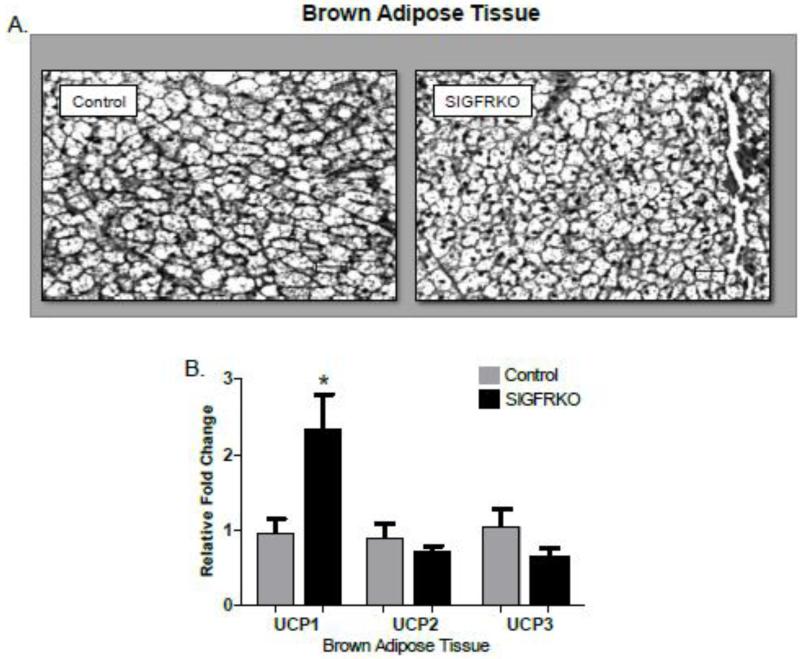
Figure 3.
Brown adipocyte tissue morphology analyzed by H&E staining and gene expression. (A) Brown adipocyte tissue depot (B) Quantitative RT-PCR demonstrated a significant relative fold increase in gene expression of UCP1, but no significant differences were found in UCP2 or UCP3. (*p<0.05, bars represent S.E.M.)

