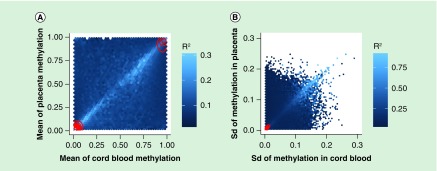
Figure 4. . R2 between measured and support vector machine-predicted placental methylation levels in terms of the average (A) and the standard deviation (B) of both cord blood and placental methylation values across all subjects.
Each hexagon bin’s color corresponds to the mean of the R2 of all the CpG sites contained in that bin and the overlaid red contour lines show the density of the set of analyzed sites. SVM: Support vector machine.

