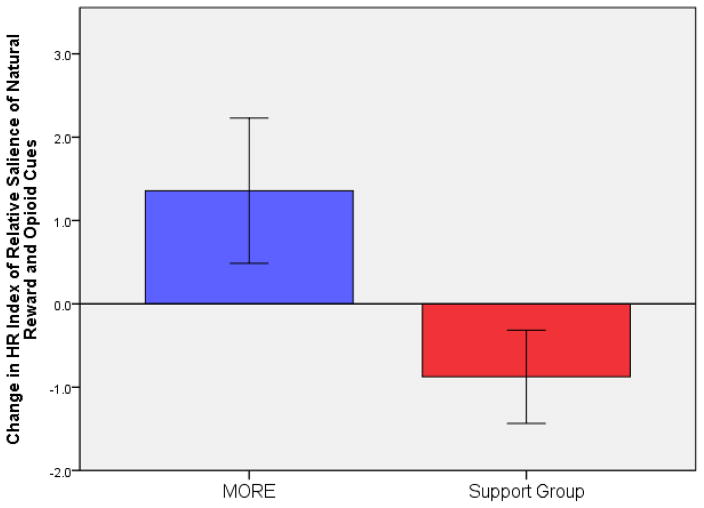
Figure 1.
Changes in relative responsiveness to natural reward and opioid cues from pre- to post-intervention (N=51). Positive scores indicate increased natural reward cue-elicited HR relative to opioid cue elicited HR. Negative scores indicate decreased natural reward cue-elicited HR relative to opioid cue-elicited HR. The Group X Time effect was significant, F(1,49) = 7.61, P = .008, η2partial = .13.

