
Fig. 2.
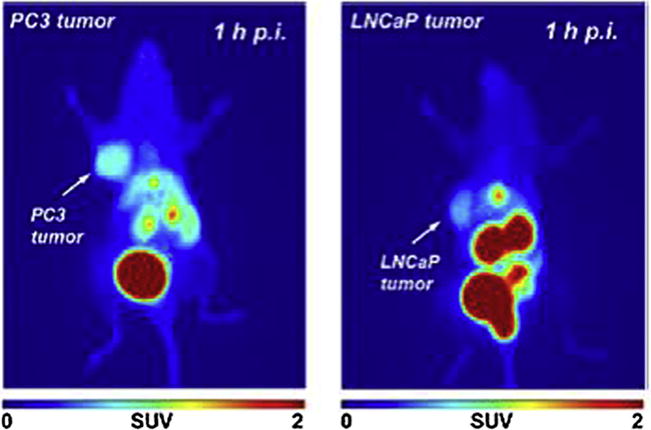
Representative PET images (maximum intensity projection) of PC-3 (left) and LNCaP tumor-bearing BALB/c mouse (right) at 60 min after injection of 68Ga-NOTA-BBN2. Adapted with permission from [57]
Official websites use .gov
A
.gov website belongs to an official
government organization in the United States.
Secure .gov websites use HTTPS
A lock (
) or https:// means you've safely
connected to the .gov website. Share sensitive
information only on official, secure websites.
Representative PET images (maximum intensity projection) of PC-3 (left) and LNCaP tumor-bearing BALB/c mouse (right) at 60 min after injection of 68Ga-NOTA-BBN2. Adapted with permission from [57]