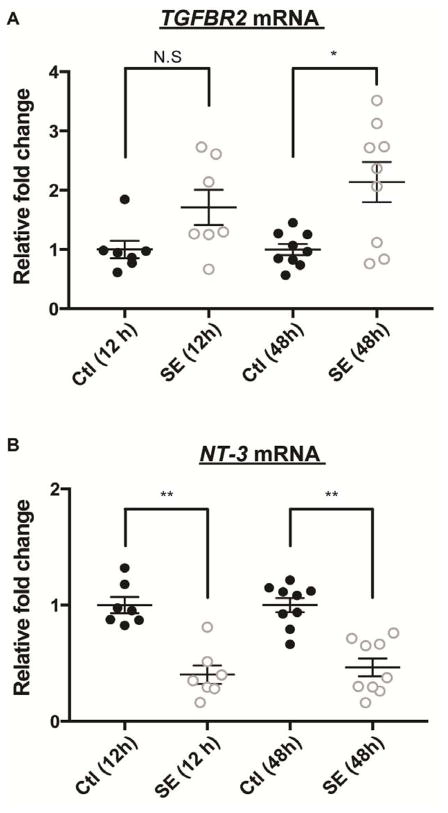
Figure 3. TGFBR2 mRNA and NT-3 mRNA levels at 12 and 48 h post SE.
Quantitative RT-PCR of TGFBR2 mRNA and NT-3 mRNA from the rat hippocampal lysate at 12 and 48 h after SE. (A) The TGFBR2 mRNA level in SE group was elevated by 1.7-fold at 12 h and 2.14-fold at 48 h compared to the control group. The 48 h SE group showed statistically significant increase. (B) The NT-3 mRNA level was significantly reduced at both 12 h (0.4±0.089) and 48 h (0.46±0.076) post SE compared to the control group. Relative fold change was normalized to housekeeping PPIA (cyclophilin) mRNA expression. Shown are mean±SEM. Control N= 7 samples and SE N= 9 samples. One-way ANOVA, Kruskal-Wallis test. *p<0.05, ** p<0.01, N.S.= not significant.

