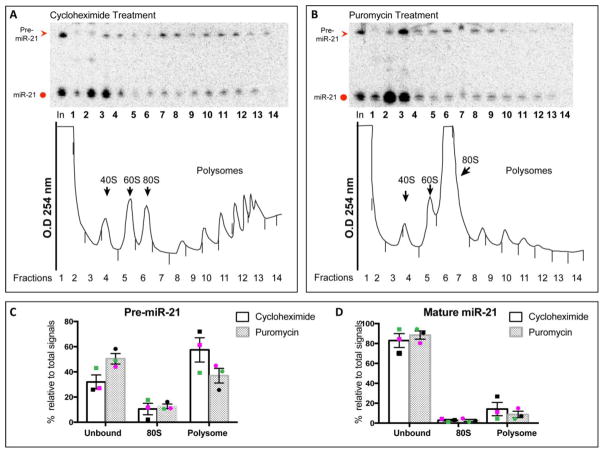
Figure 5. Pre-miR-21 is associated with mRNAs engaged in active translation.
(A & B) Representative Northern blots of ribosome profiles generated from lysate of U-87 cells that were treated with either cycloheximide (A) or puromycin (B) as described in Methods. (A) Top: Northern analysis to detect pre-miR-21 (red arrowhead) and mature miR-21 (red circle) in each of the fractions across the profile. Bottom: Tracing of the profile at 254 nm shows distinct peaks for ribosome subunits, monosome and polysome as indicated (arrows). (B) Top: Northern analysis to detect pre-miR-21 and mature miR-21 (red arrowhead) and mature miR-21 (red circle) in each of the fractions across the profile. Bottom: Tracing of the profile at 254 nm shows loss of polysomes and an accumulation of the 80S monosomes (arrowhead). Quantification of the levels of pre-miR-21 (C) and mature miR-21 (D) in three independent polysome profiles. Unbound= fractions 1–5, 80S= fraction 6, polysome= fractions 7–14. Percentage calculated is relative to the sum of fractions 1–14. Black, magenta, and green data points represent three independent polysome profiling experiments.

