
Fig 3. Variations in heart rate frequency as a function of Assessment Time for the cycling in silence condition (grey) and for the cycling in music condition (black).
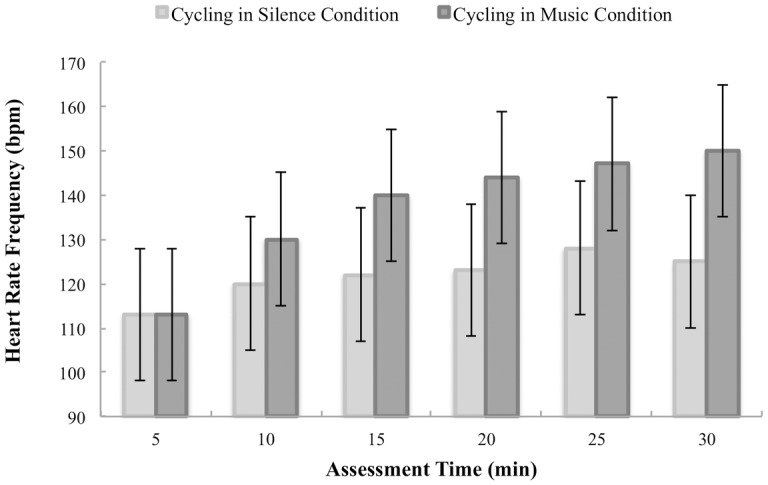
Error bars illustrate the confidence intervals 95% around the mean.
Official websites use .gov
A
.gov website belongs to an official
government organization in the United States.
Secure .gov websites use HTTPS
A lock (
) or https:// means you've safely
connected to the .gov website. Share sensitive
information only on official, secure websites.
Error bars illustrate the confidence intervals 95% around the mean.