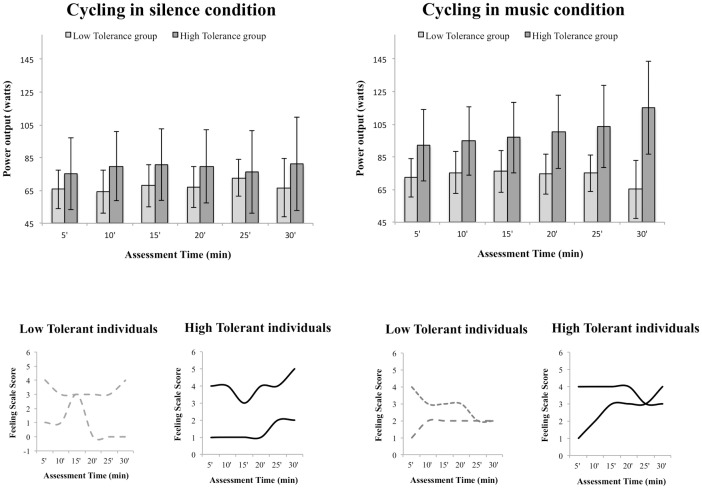
Fig 4. Variations in power output and Feeling Scale.
Variations in power output (Top) as a function of Assessment Time for the Low Tolerance groups (grey) and the High Tolerance groups (black) in the cycling in silence condition (left) and the cycling in music condition (right). Error bars illustrate the confidence intervals 95% around the mean. Scores obtained on the Feeling Scale throughout the 30’ exercise session are presented (Bottom) for 8 typical individuals in order to illustrate the non-linearity of the modulations in affective states, whether cycling in silence or in music.

