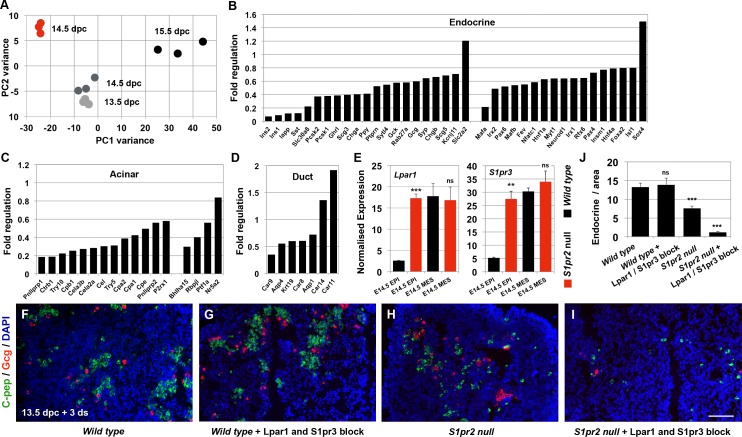
Fig 2. S1pr2 null pancreata are developmentally delayed but up-regulate Lpar1 and S1pr3.
(A-D) PCA of RNA Seq gene expression profiles of 14.5 dpc S1pr2tm1Rlp null pancreata (in red) and 13.5, 14.5, and 15.5 dpc wt pancreata (in shades of black). PC1 shows developmental time because it shows the highest variability among wt samples and there is only a small variance in PC2. S1pr2 null pancreata cluster away from their wt counterparts, suggesting that they were developmentally delayed (A). Analysis of these RNA Seq data revealed that endocrine- (B) and acinar- (C) specific genes were strongly repressed in S1pr2 null pancreata at 14.5 dpc as compared to 14.5 dpc wt controls, whereas expression of duct-specific genes was less affected (D). (E) qPCR analysis of Lpar1 and S1pr3 expression in the FACS-isolated epithelial and mesenchymal components of 14.5 dpc wt (black bars) and S1pr2 null (red bars) pancreata indicated that expression of both Lpar1 and S1pr3 was selectively up-regulated in the S1pr2 null epithelium by 7- and 5-fold, respectively. (F-J) air–liquid interface (ALI) cultures of 13.5 dpc wt embryonic pancreata for 3 d results in the generation of several C-pep+ and Gcg+ cells (F), and combined treatment with 20 μM and 50 μM of the specific Lpar1 and S1pr3 inhibitors, respectively, had no effect (G, J). In contrast, the already reduced number of endocrine cells in the S1pr2 nulls (H, J) is further reduced upon addition of the two antagonists in these concentrations (I, J). Padj for all genes <0.05 except Foxa2 where Padj <0.1 (B-D); **p < 0.01, ***p < 0.001, ns not significant in reference to corresponding epithelial or mesenchymal values (E, F); error bars in E show SEM; error bars in J show standard deviation (SD); scale bars are at 80 μm. For raw data, please refer to the S1 Data file.

