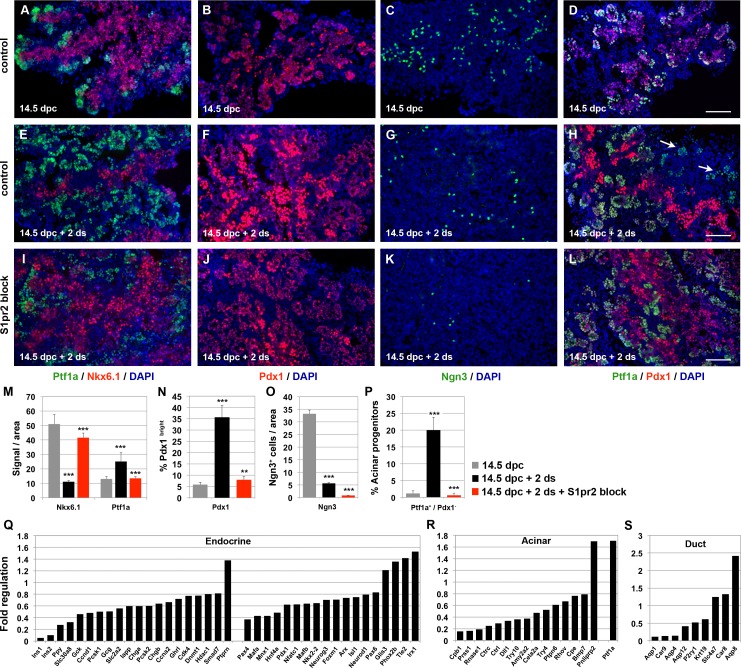
Fig 3. S1pr2 signalling promotes commitment of pancreas progenitors.
(A-H) Immunofluorescence analysis of embryonic pancreata at 14.5 dpc and after 2 d in ALI cultures (14.5 dpc + 2 d) shows the progression of the developmental program. This was apparent by the reduction of Nkx6-1+ (A, E) and Ngn3+ (C, G) progenitor cells, the corresponding increase of strongly labelled Pdx1+ cells (B, F) and the appearance of Ptf1a+/Pdx- cells (D, H; arrows in H). (I-L) Immunofluorescence analysis at 14.5 dpc + 2 d in the absence of S1pr2 signalling clearly showed that the Nkx6-1+ population was expanded (I), Ngn3+ cells (K) and strongly labelled Pdx1+ cells (J) were dramatically reduced, and Ptf1a+/Pdx1- cells were lost (L). (M-P) Quantitation of Nkx6.1+and Ptf1a+ cells (M), Pdx1+ cells (N), Ngn3+ cells (O), and acinar progenitors (Ptf1a+ / Pdx1-) (P) in 14.5 dpc pancreata, 14.5 dpc pancreata cultured in ALI for 2 d in the absence or presence of 15 uM of the S1pr2 specific inhibitor JTE013. Statistical significance is shown for the comparisons between 14.5 dpc and 14.5 dpc + 2 d stainings (14.5 dpc + 2 d bar) as well as between 14.5 dpc + 2 d with and without S1pr2 block (14.5 dpc + 2 d + S1pr2 block bar). (Q-S) RNA Seq gene expression analysis on 14.5 dpc pancreatic explants after 2 d in ALI culture with S1pr2 signalling blocked revealed a coordinated repression of transcription factors and terminal differentiation markers of the endocrine (Q) and acinar (R) lineages and, to a lesser extent, of the ductal lineage (S) compared to untreated control explants at 14.5 dpc + 2 d. Scale bars, 80 μm; **p < 0.01, ***p < 0.001, Padj for all genes <0.05; error bars M, N, P show SD; error bars in O show SEM. For raw data, please refer to the S1 Data file.

