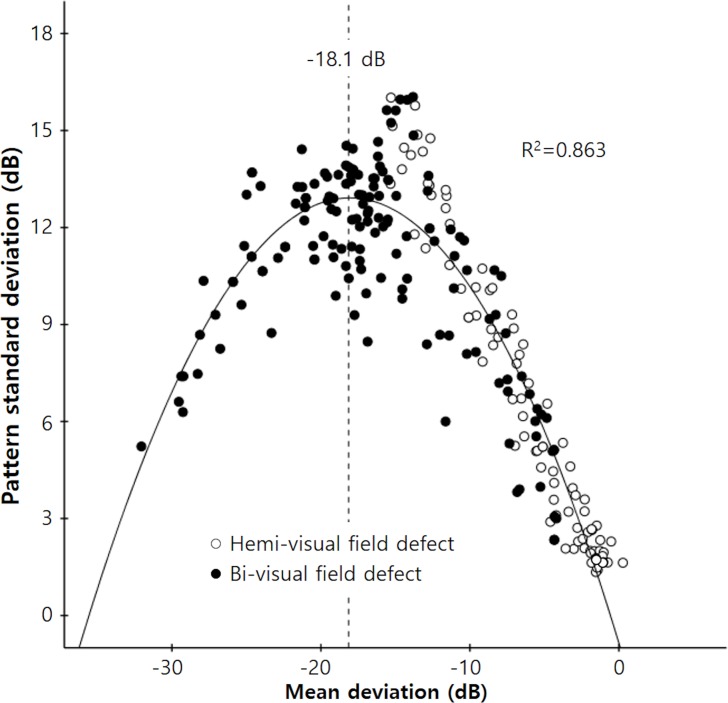
Fig 2. Scatterplot showing the relationship between mean deviation (MD) and pattern standard deviation (PSD).
PSD increased as MD decreased from 0 dB to −18.1 dB, and PSD then decreased as MD deteriorated further. Correlations were calculated using the following equation: Y = −0.817 + 1.523X − 0.042X2 (r2 = 0.863, P < 0.001). In the hemi-optic neuropathy group, in which MD values were localized to the right side, the relationship between MD and PSD was more linear in distribution, the correlation coefficient (r) was −0.973, and the linear regression coefficient (β) was −0.965 (P < 0.001).

