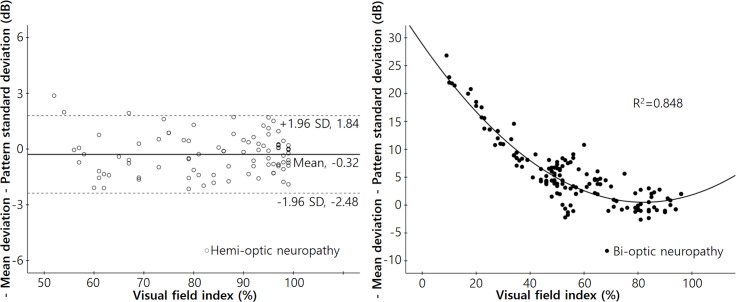
Fig 4. Scatterplots of the differences between the negative MD and PSD values with respect to the visual field index in each group.
Left: A scatterplot of the difference between the negative MD and PSD values (−MD−PSD) with respect to the visual field index (VFI) of patients with hemi-optic neuropathy (either superior or inferior) (r2 = 0.0001, P = 0.916). The mean “−MD−PSD” was −0.32 dB, and the 95% confidence interval ranged from −2.48 dB to 1.84 dB. Right: A scatterplot of the “−MD−PSD” with reference to the VFI in patients with bi-optic neuropathy (thus both superior and inferior). The ‘−MD−PSD” increased significantly as the VFI decreased. Correlations were calculated using the following equation: Y = 28.868 − 0.690X + 0.004X2 (r2 = 0.848, P < 0.001).

