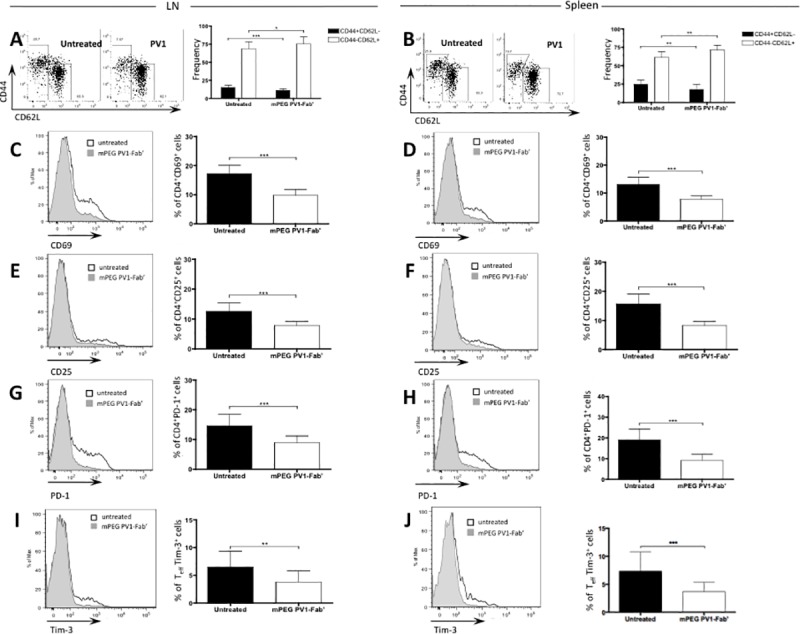
Fig 3. PV1-treated mice exhibited a decrease in overall activation of T lymphocytes.

B10.RIII mice were immunized with 50 μg/animal of 161–180 IRBP in CFA, plus 500 ng/animal of PTx boost. Starting on day 9, mice were treated every 4 days with CD28 antagonist, PV1 (10mg/Kg; ip), or left untreated. On day 14 mice were sacrificed and spleen and dLN were collected for immunophenotyping. (A) Representative plot for CD44 and CD62L expression in T CD4+ lymphocytes, and frequencies of CD44+CD62L- (effector) and CD44-CD62L+ (naïve) CD4+ T lymphocytes in dLN and (B) spleen. (C) Representative plot for expression of CD69 in CD4+ lymphocytes and frequency of CD4+CD69+ T cells in dLN and (D) spleen. (E) Representative plot for expression of CD25 in CD4+ lymphocytes and frequency of CD4+CD25+ T cells in dLN and (F) spleen. (G) Representative plot for expression of PD-1 in CD4+ lymphocytes and frequency of CD4+PD-1+ T cells in dLN and (H) spleen. Data combined from three independent experiments; 5 mice per group. Representative plot for expression of Tim-3 in CD4+CD44+CD62L- lymphocytes and frequency of CD4+CD44+CD62L-Tim-3+ T cells in (I) dLN and (J) spleen. Data combined from three independent experiments; 5 mice per group. Mean ± SD are depicted.*, p<0.05; **, p<0.01; ***, p<0.0001, two-tailed Mann-Whitney test.
