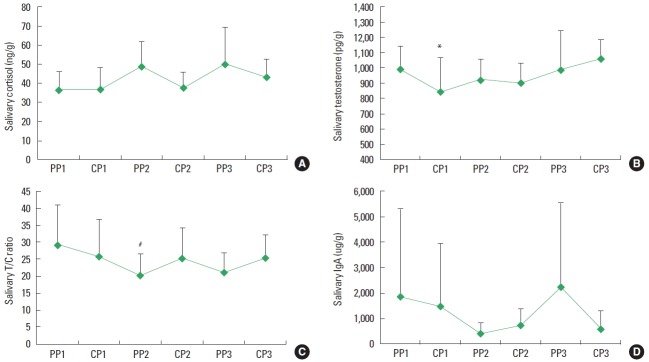
Fig. 2.
Changes in salivary cortisol (A), testosterone (B), testosterone to cortisol (T/C) ratio (C), and salivary IgA (D) during three preparatory periods (PP) and three competitive periods (CP), Values are presented as mean±standard deviation. *P<0.05, different from CP3 values. #P<0.01, different from PP1 values.

