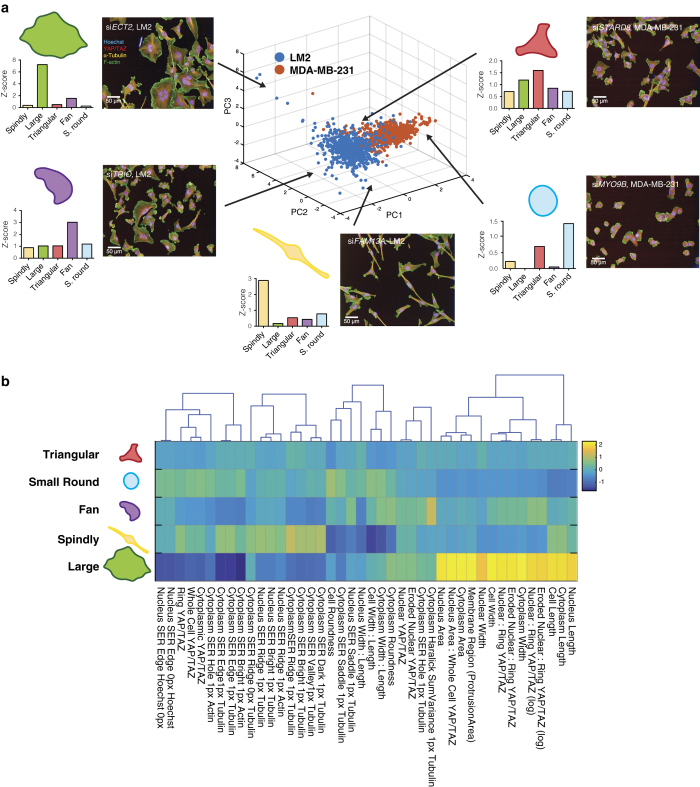
Figure 2. Linear classification of shapes.
(a) PCA was applied to the Z-score of shapes that cells were classified into for ONTARGETPlus screens for LM2 (blue) and MDA-MB-231 (orange). siRNA treated populations enriched for each shape (as judged by Z-scores) are depicted: spindly in yellow, large in green, triangular in red, fan in purple, and small and round in blue. (b) Heat map and dendrogram of the features Columbus software used to classify cells into the chosen 5 shapes, based on the cluster means for negative and positive control data (wild-type and ECT2 siRNA which enriches for the large spread morphology absent in wild type). For example, cells classified into large shape scored high for cytoplasm and cell length and width, and cytoplasm and nuclear area. On the other hand, cells classified into spindly shape scored low for cytoplasm and cell width to length ratio, and cytoplasm and cell roundness. Yellow and dark blue represent a high and a low score respectively in arbitrary units.

