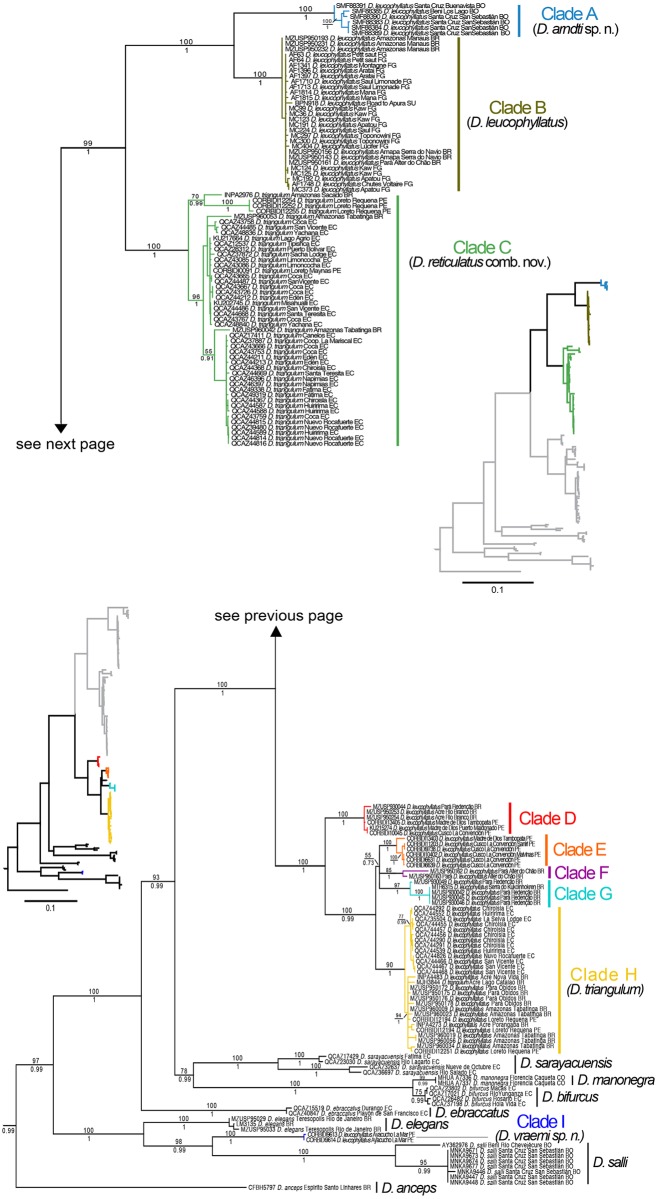
Fig 1. Maximum likelihood phylogram depicting relationships within the Dendropsophus leucophyllatus species group.
The phylogram was derived from analysis of 3400 bp of mitochondrial DNA (gene fragments 12S, 16S, ND1 and CO1). Museum catalog numbers and localities are shown for each sample. Bootstrap values are shown above the branches and Bayesian posterior probabilities are shown below; missing values indicate values below 50 (bootstrap) or 0.5 (posterior probability). Outgroup species (Dendropsophus brevifrons, D. carnifex, D. parviceps and D. rhodopeplus) are not shown. Abbreviations are: BO Bolivia, CO Colombia, EC Ecuador, FG French Guiana, PE Peru, SU Suriname.

