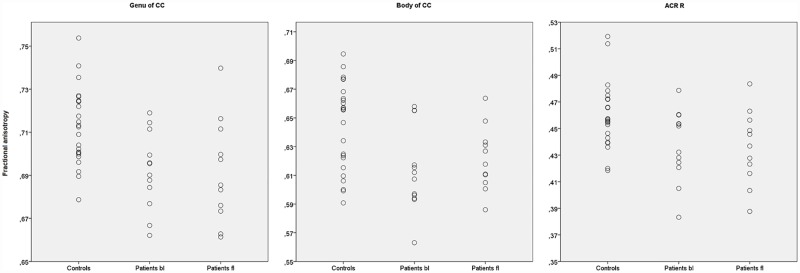
Fig 3. Between-groups differences in FA values.
The scatterplots report the FA values of the structures were differences were found between the patients at baseline and controls. The three most extensively involved structure are reported. CC = Corpus Callosum, ACR = Anterior Corona Radiata, bl = baseline, fl = follow-up.

