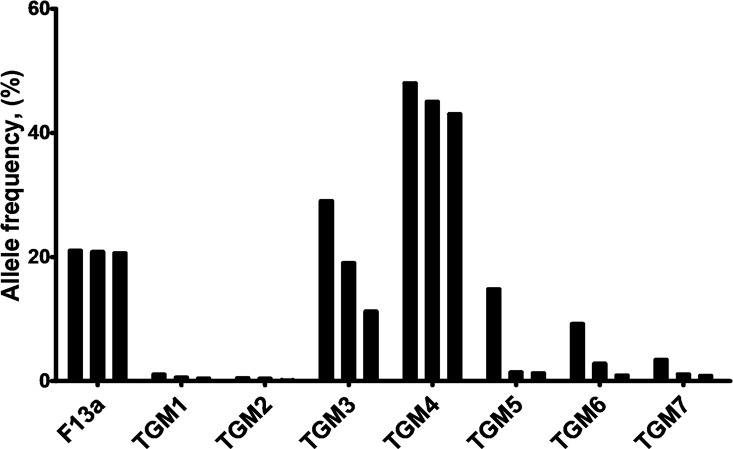
Fig 2. Allele frequencies of three most frequent non-synonymous variants in transglutaminase family genes.
Values were calculated based on the ExAC database. For each family, nsSNVs with top three allele frequency (%) values are shown. F13a: p.Pro565Leu (21%), p.Glu652Gln (20.8%), p.Val35Leu (20.6%); TGM1: p.Val518Met (1.04%), p.Glu520Gly (0.56%), p.Ser42Tyr (0.40%); TGM2: see in text; TGM3: p.Gly654Arg (28.7%), p.Thr13Lys (19%), p.Ser249Asn (11.2%); TGM4: p.Glu313Lys (49%), p.Val409Ile (44.7%), p.Arg372Cys (42.8%); TGM5: p.Ala352Gly (14.8%), p.Val504Met (1.4%), p.Gln521Arg (1.25%); TGM6: p.Met58Val (9.2%), p.Arg448Trp (2.80%), p.Ala141Glu (0.9%); TGM7: p.Pro564Leu (3.4%), p.Val103Leu (1.07%), p.Val515Leu (0.82%).

