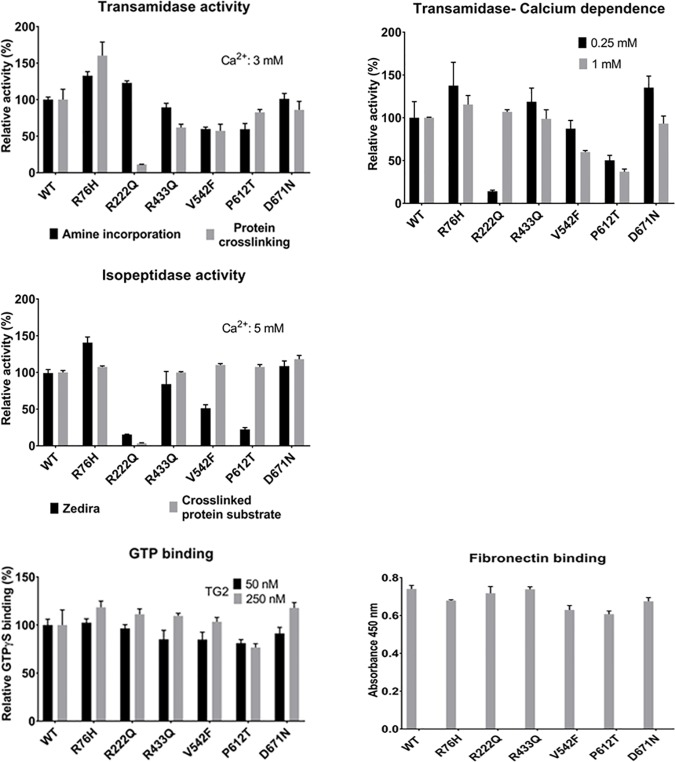
Fig 3. Biochemical characterization of the six homozygous nsSNVs of TGM2.
Kinetic characterization of the transamidase activity of TGM2 variants and wild type at 3 mM CaCl2 concentration using amine incorporation assay [56] and protein crosslinking assay [17]. Calcium dependence of kinetic transamidase reaction with 0.25 and 1 mM calcium concentrations using amine incorporation assay. Comparison of the kinetic isopeptidase activity of TGM2 variants at 5 mM CaCl2 concentration using Zedira assay and crosslinked protein substrate [18]. The relative activities are calculated as a percentage of the activity values of the wild type TGM2. Comparison of BODIPY FL GTPγS binding of variants and wild type TGM2 proteins with different concentrations of TGM2 (50 and 250 nM). The change in the fluorescence intensity (Ex/Em: 485/520 nm) was determined after 15 minutes of incubation. Binding is shown as a percentage of maximum binding in case of wild type TGM2 [29]. The Fibronectin binding property of the TGM2 variants was tested using a previously published direct ELISA assay [16]. Data are presented as means with ± standard deviations from three separate experiments done in triplicate. All the data were analyzed by GraphPad Prism 7.

