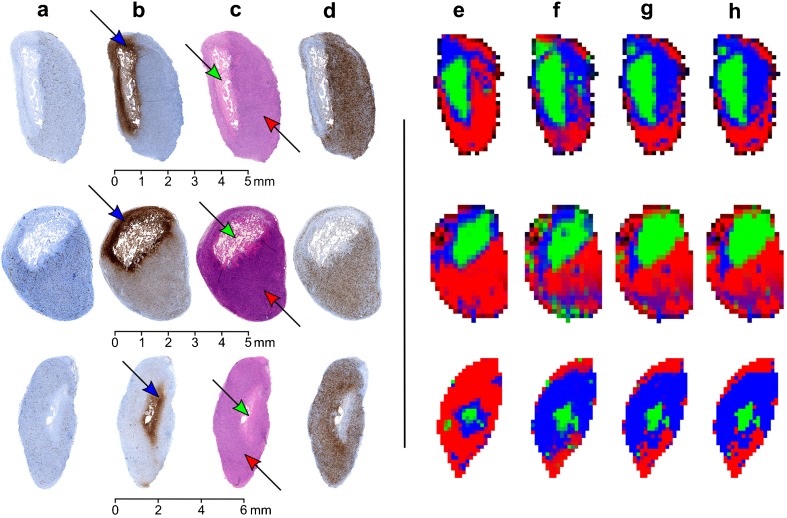
Fig. 2.
a CD-31, b GLUT-1, c H&E, and d Ki-67 stained histology of three different tumors and corresponding segmentation maps obtained using e SRSC, f GMM, g FCM, and h K-means. Green, blue, and red colors represent the necrotic, peri-necrotic, and viable tissue, respectively. The arrows in the histology indicate the corresponding tissue type in the tumor.

