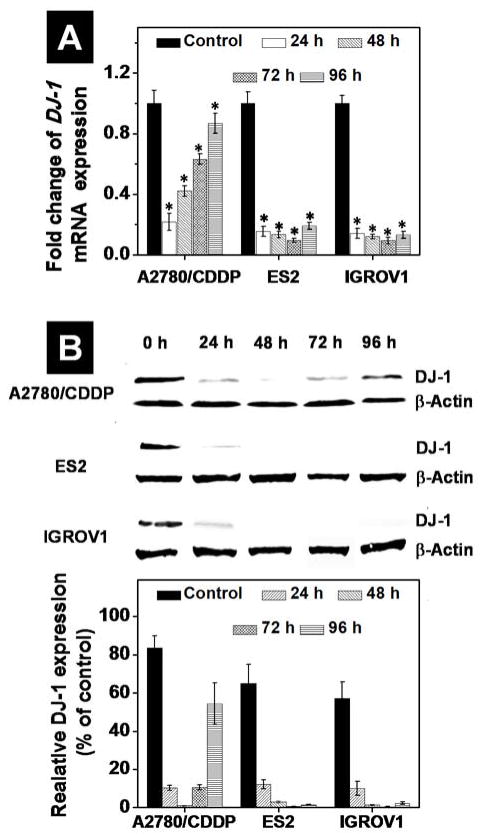
Figure 5.
Quantitative PCR analysis (A) and band densitometry analysis of Western blots (B) reveal expression of DJ-1 mRNA and corresponding protein levels in A2780/CDDP, ES2 and IGROV1 ovarian cancer cells before (basal level) and after treatment with the DJ-1 siRNA-loaded nanoplatform for 24 h. Band intensities of DJ-1 protein are expressed as the percentage of the β-actin band intensity, which was set as 100%. Time point evaluation (24–96 h) was performed to determine the duration of the siRNA silencing effect on DJ-1 levels following a single transfection in all cell lines. Means ± SD are shown. *p < 0.05 when compared with untreated cancer cells.

