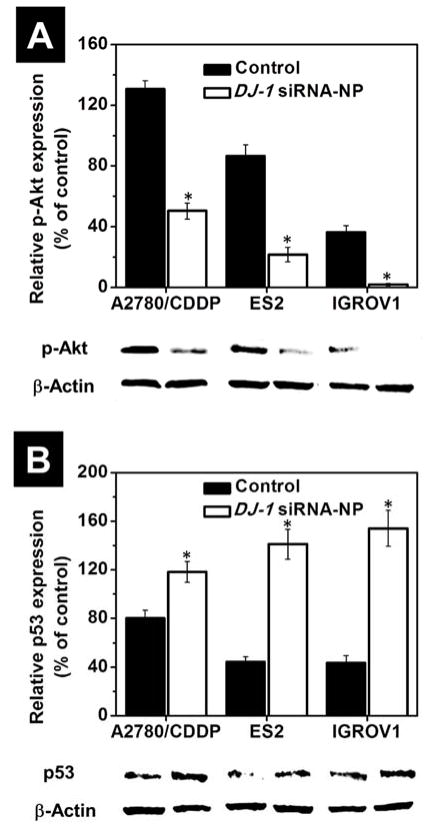
Figure 9.
The intracellular level of phosphorylated Akt (A) and p53 (B) proteins in A2780/CDDP, ES2 and IGROV1 cells before after treatment with DJ-1 siRNA-NP for 24 h. Expression of proteins was evaluated by band densitometry analysis of Western blots from replicate experiments. Band intensities of phosphorylated Akt and p53 proteins are expressed as the percentage of the β-actin band intensity, which was set as 100%. Means ± SD are shown. *p < 0.05 when compared with cancer cells treated with media. Representative Western blot images of phosphorylated Akt, p53 and β-actin proteins expression in the ovarian cancer cells before and after exposure to the DJ-1 siRNA treatment are provided.

