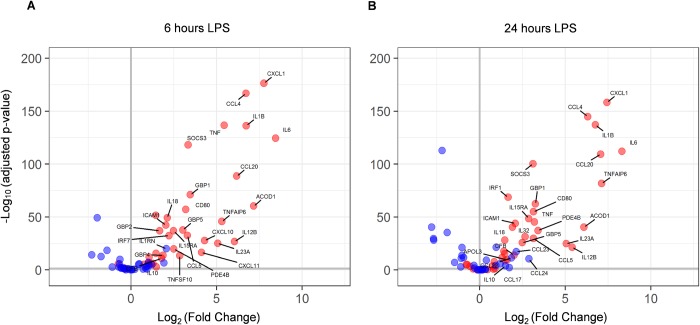
Fig 2. M1/M2 polarisation of LPS stimulated genes.
Volcano plot of M1 (red) and M2 (blue) genes at 6 hours (A) and 24 hours (B) after LPS induction. Differential expression of unstimulated vs. LPS stimulated cells was tested using DESeq2 and the Log2 fold change (x-axis) is plotted against the–Log10 adjusted p-values (y-axis). Genes with LFC > 1.5 are labelled by name. The vertical grey lines denotes no LPS induced expression change. The horizontal grey lines shows the 0.05 adjusted p-value cut-off.

