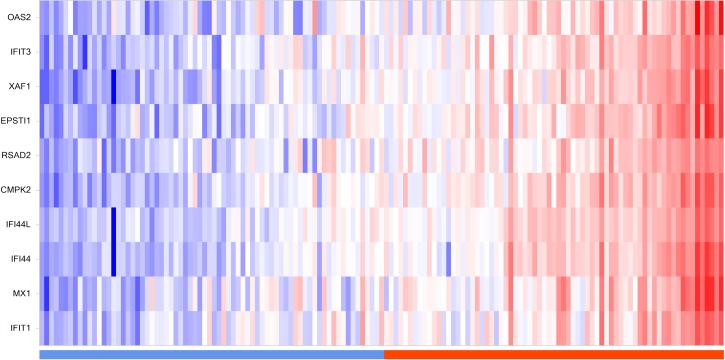
Fig 9. Signature distribution in ECLIPSE sputum samples.
Heat map of the ECLIPSE sputum data for the 10 signature genes. Samples are ordered according to the enrichment scores generated by GSVA with the 10 gene signature. The value distribution is shown in the top panel. Data was normalized by subtracting the row median then scaling by the row median absolute deviation. Red color denotes high expression; blue color denotes low expression. Bar below indicates GSVA enrichment score for these samples as either negative (blue) or positive (orange).

