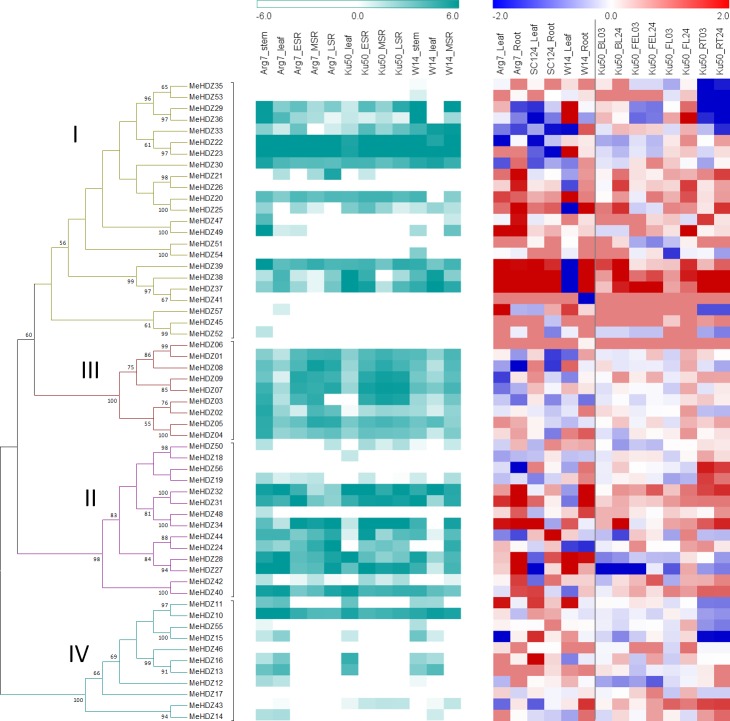
Fig 5. Expression profiles of MeHDZ genes in cassava.
(A) Expression of MeHDZ genes in different tissues of three genotypes. Log2-transformed FPKM value was used to plot the heatmap. ESR: early storage root; MSR: middle storage root; LSR: last storage root. (B) Expression of MeHDZ genes in response to drought and PEG treatments. Log2 based fold change of treatment/control was used to plot the heatmap. FL: folded leaf; FEL: full expanded leaf; BL: bottom leaf; RT: root. The numbers attached behind samples represented the time points at which samples were collected: e.g., 03 and 24 represented 3 and 24 h, respectively.

