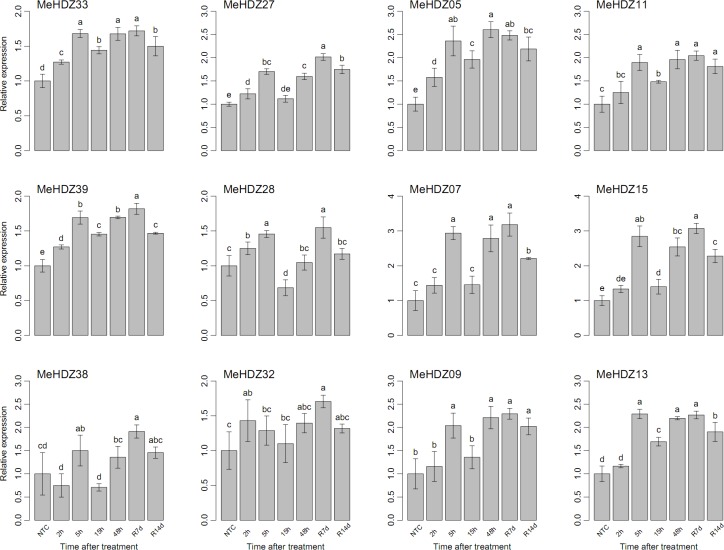
Fig 6. Relative expression of MeHDZ genes in leaves under cold treatment.
NTC (no treatment control) was normalized as “1” at each graph. Data were shown as mean ± standard deviation derived from three biological replicates, and values with different letters were significant based on Duncan’s multiple range tests (P < 0.05, n = 3).

