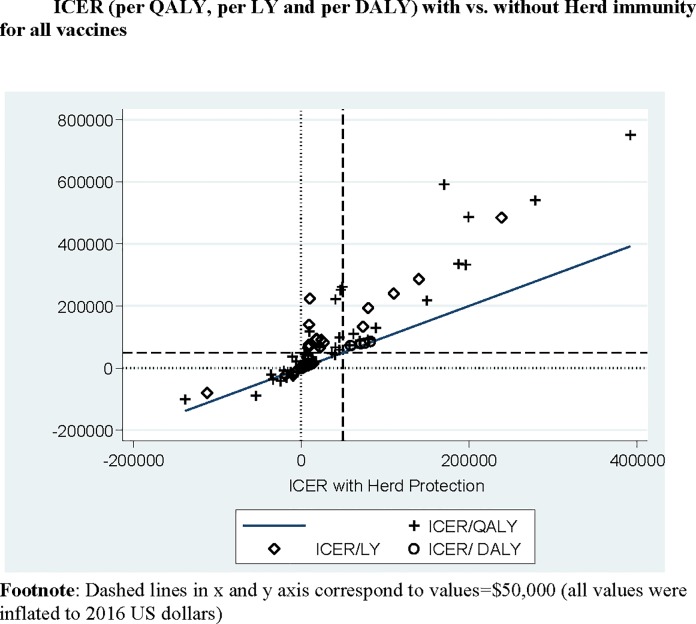
Fig 3. Scatterplot of ICERs (per-QALY gained, per-LY gained and per-DALY averted) with vs. without herd-protection across all four vaccines.
Y-axis: ICERs without herd protection and X-axis: ICERs with herd-protection (values inflated to 2016 US dollars, [29]); Dashed lines in the horizontal and vertical axis correspond to $50,000 threshold without and with herd-protection respectively. (ICERs in the left upper quadrant indicate cases where ICERs were > $50,000 without herd-protection and crossed that threshold with Herd Protection).

