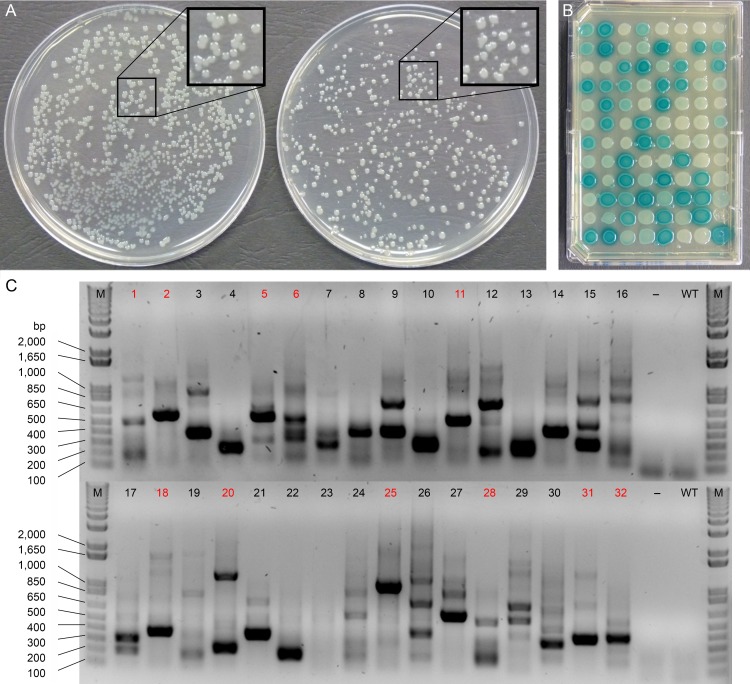
Fig 1. Preliminary characterization of Psa transposon mutants.
(A) Colony size variation between wild-type Psa (left) and transposon mutants (right). A region of each plate, boxed in black, is enlarged (2×) for comparison; (B) Evaluation of the ability of transposon mutants to express GUS on KB-Km agar medium containing X-Gluc; (C) Arbitrary PCR to amplify transposon insertion sites from the genomic DNA of 32 independent transposon mutants (1–32). PCR amplicons from samples labelled in red were sequenced to characterize the specific location(s) of genome insertion by the transposon. M = DNA ladder, bp = base pairs,– = H2O negative control, WT = wild-type Psa genomic DNA.

