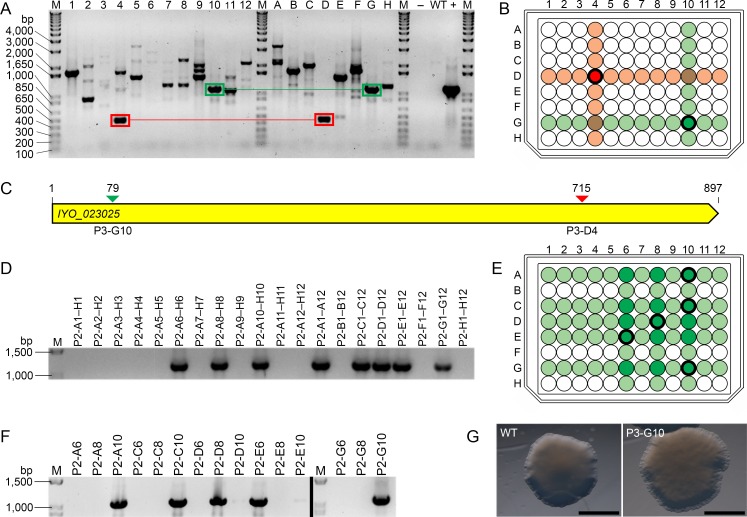
Fig 5. Validation of the Psa mutant of interest (MOI) library.
(A) PCR screen to identify disruptions in the IYO_023025 gene. Pooled genomic DNA samples from the columns (lanes 1–12) and rows (lanes A–H) of MOI library plate 3 (P3) were used as templates for PCR. Two sets of amplicons that share a specific IYO_023025 disruption across a single pooled column and row sample are boxed in green and red, respectively; (B) Location of the P3-G10 and P3-D4 wells, which contain a mutant with an IYO_023025 disruption specific to the PCR amplicons boxed in green and red in (A), respectively; (C) Schematic of the IYO_023025 gene showing the location of transposon insertion sites identified in (A). Transposon insertion sites are denoted by arrows, and are color-coded to match the PCR amplicons boxed green and red in (A); (D) PCR screen to identify the IYO_023025 disruption mutant from well P3-G10. Pooled genomic DNA samples from the columns and rows of a 96-well plate (P2) containing independent colony-forming units of well P3-G10 were used as templates for PCR; (E) Location of intersecting wells in P2 (dark green) that possibly contain the IYO_023025 P3-G10 disruption mutant, as determined by the PCR amplicon profile in (D); (F) PCR screen to determine which of the intersecting wells in (E) contain the IYO_023025 P3-G10 disruption mutant. Amplicons shown in the left and right panels (separated by a black line) are derived from different regions of the same gel. Wells that contain the mutant are shown in bold in (E); (G) Colony morphology of wild-type (WT) Psa and the IYO_023025 P3-G10 disruption mutant. Bar = 2 μM, M = DNA ladder, bp = base pairs,– = H2O negative control, WT = WT Psa DNA.

