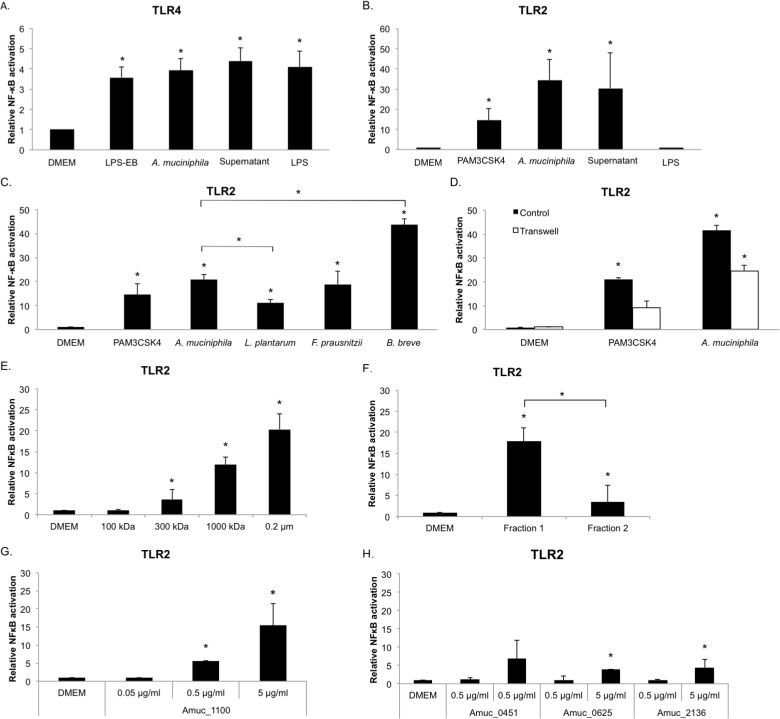
Fig 1. A. muciniphila activates signaling pathways through TLR2 and TLR4.
(A) TLR4 signaling by live A. muciniphila (~107 bacteria/well), A. muciniphila supernatant (~5 μg of protein/well) and LPS isolated from A. muciniphila (concentration corresponds to amount of LPS in ~107 A. muciniphila cells, ~105–106 EU/ml). DMEM: medium control, LPS-EB: positive control (concentration corresponds to amount of LPS in ~107 E. coli cells). (B) TLR2 signaling by live A. muciniphila (~107 bacteria/well), A. muciniphila supernatant (~5 μg of protein/well) and LPS. DMEM; medium control, PAM3CSK4; positive control. (C) TLR2 signaling by live A. muciniphila, L. plantarum, F. prausnitzii and B. breve (~106 bacteria/well). (D) TLR2 signaling in a Transwell system compared to control (i.e. samples not separated from the cell line by a membrane, ~4 × 10⁷ bacteria/well). (E) TLR2 signaling by filtrated supernatant signaling molecules. (F) TLR2 signaling by A. muciniphila bacterial fractions (1 μg of protein/well). (G) TLR2 signaling by A. muciniphila purified protein Amuc_1100 (0.01, 0.1 and 1 μg of protein/well). (H) TLR2 signaling by A. muciniphila purified proteins Amuc_0451, Amuc_0625 and Amuc_2136 (0.1 and 1 μg of protein/well). DMEM; medium control, *, P<0.05 compared to DMEM. All experiments were performed in triplicate and statistical analysis was performed by one-way analysis of variance (ANOVA) followed by Tukey’s HSD if homogeneity of variance was met or Games-Howell if variance was unequal.

