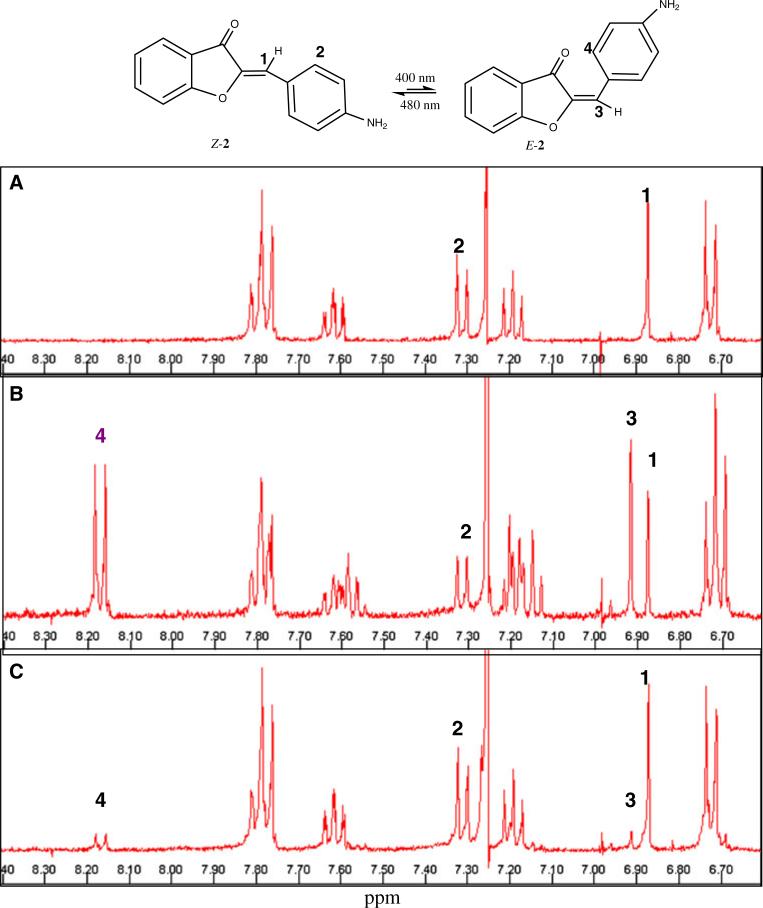
Fig. 4.
NMR spectrum of 2 in deuterated chloroform (CDCl3). a Z-isomer of 2 in CDCl3. The numbers 1–4 refer to the protons (or sets of equivalent protons) that are affected by the radiation of the Z-isomer to E-isomer. b after exposure to 400 nm radiation for 1 h. The olefinic peak (1) of the Z-isomer shifts from 6.87 to 6.91 ppm (3) (which is characteristic of the E-isomer). Note that the peak labeled (2) in the Z-isomer undergoes a significant downfield shift in the E-isomer (4). The ratio of E-isomer to Z-isomer is 60:40, based on the relative integration of the resolved peaks. C: Spectrum after exposure of the sample to 480 nm radiation for 1 h. About 95% of the sample is the Z-isomer occurs as is evident from the decrease in the 6.91 ppm peak

