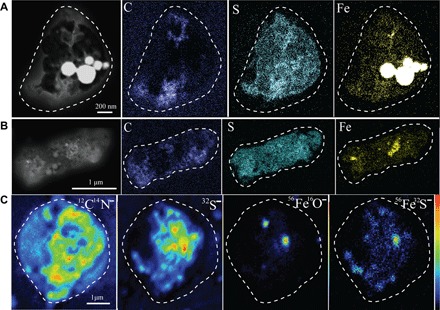
Fig. 3. Dark-field TEM images and elemental maps of C, S, and Fe and NanoSIMS ion intensity maps of CN−, S−, FeO−, and FeS− of an individual Fe-bearing particle.

(A and B) Elemental maps showing two individual sulfate particles with Fe-rich particles (as hotspots). (C) Ion intensity maps showing the presence of OM, sulfate, Fe oxide, and Fe sulfate.
