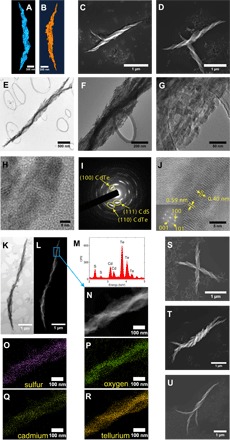
Fig. 1. Structural and elemental analysis of mesoscale helices.

STEM tomography of (A) R-helix and (B) L-helix. Scanning electron microscopy (SEM) images of (C) R-helix assembled from d-Cys CdTe NPs and (D) L-helix assembled from l-Cys CdTe NPs. TEM images of an R-helix at (E) low, (F) medium, and (G) high magnification. (H) High-resolution TEM (HRTEM) of helix boundary. (I) SAED graph. (J) HRTEM of nanowire core (inset, FFT graph). (K) Bright-field STEM and (L) High-angle annular dark-field imaging-STEM (HAADF-STEM) imaging of R-helix. (M) STEM-EDX spectrum. CPS, counts per second. (N) HAADF-STEM image of the highlighted region from (L). (O to R) Elemental mapping of sulfur, oxygen, cadmium, and tellurium, respectively. SEM images of hierarchical assemblies of (S) intercrossed helices, (T) intertwined helices, and (U) dendritic twists.
