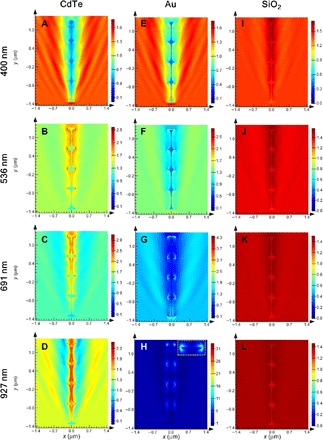
Fig. 6. Electric field profiles.

Electric field profiles at the z = 0 plane for (A to D) CdTe, (E to H) Au, and (I to L) SiO2. Four wavelengths (400, 536, 691, and 927 nm) were chosen to represent the entire spectral range. RCP light was injected from bottom to top and parallel to the axis of the helix. Inset in (H) shows the magnified view of the top of the helix. Note the difference in color scales for the different materials and wavelengths.
