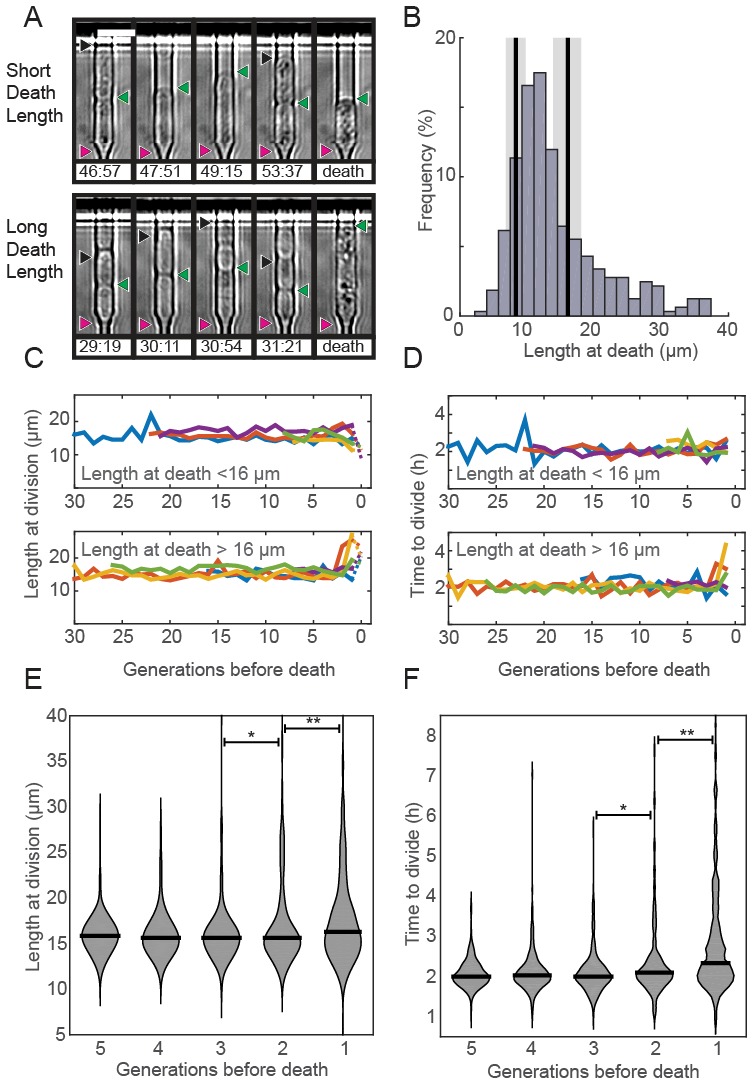
Figure 3. Fission yeast does not show signs of aging.

(A) Images of cells showing a short (top) and long (bottom) phenotype at death. Triangles indicate the old-pole, new-pole, and the new-pole of the previous division as in Figure 1G. Scale bar: 10 µm. (B) Histogram of cell length at death. The birth length was 8.3 ± 1.5 µm (mean ± st. dev., n = 326) and the length at division was 16 ± 2.2 µm (n = 326). (C) Cells dying with either short (top) or long (bottom) phenotype have normal length and (D) doubling times prior to death, as indicated by five representative cells. (E) Distribution of length and (F) doubling time at division in the five generations preceding death. Cells were post-synchronized to the time of death. The black bar shows the median value for each generation (n > 290 cells for all conditions). Sequential generations were compared using the Kolmogorov-Smirnov test (* for p<0.05, ** for p<0.01).
