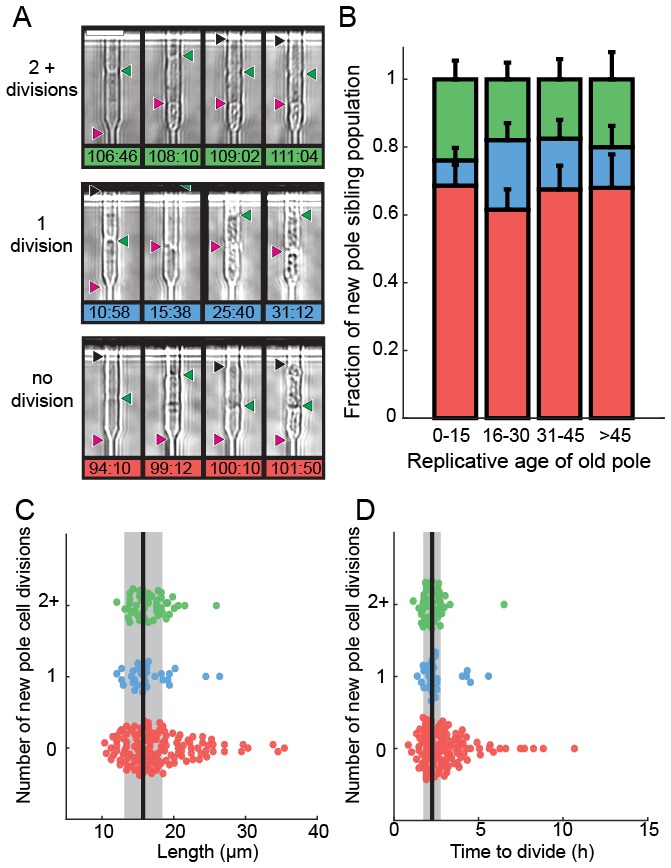
Figure 4. Analysis of siblings born during the last division of a dying cell.

(A) Last new-pole sibling continued to divide (top), died after one division (middle) or died without dividing (bottom). (B) The distribution of last-sibling phenotypes as a function of the old-pole replicative age (n = 245). Error bars are st. dev. measured by bootstrap analysis. (C) The length at division and (D) the doubling time of the new-pole siblings. Vertical black lines and gray bars show the mean and standard deviation of the total cell population.
