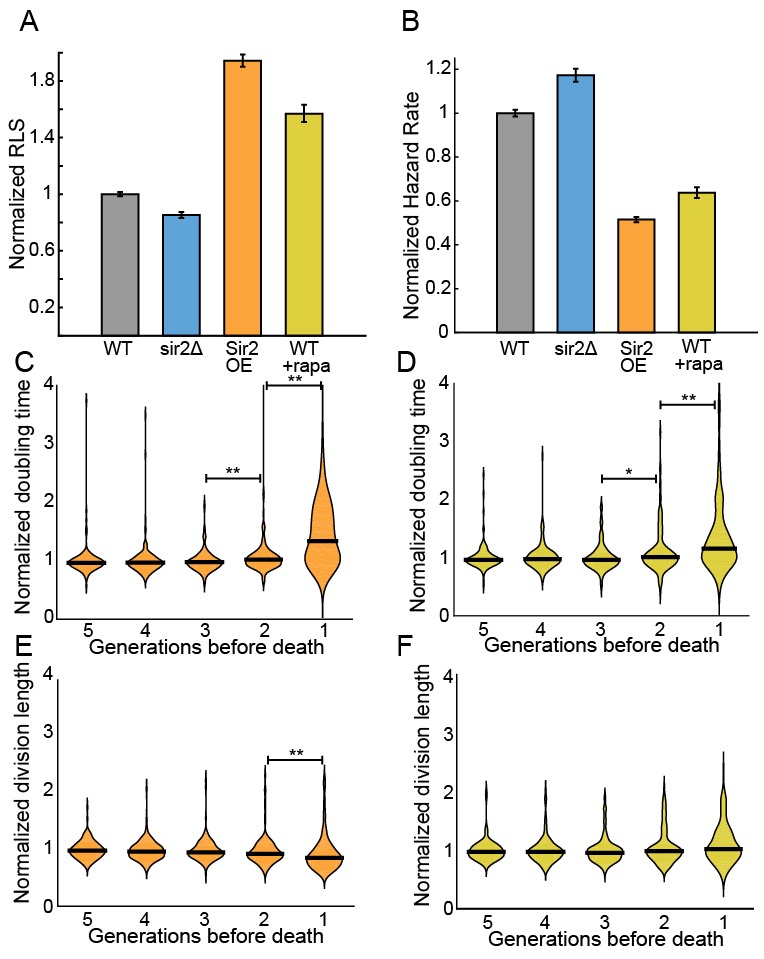
Figure 5. Sir2p and rapamycin extend replicative lifespan.
(A) Replicative lifespans and (B) hazard rates of strains normalized to the mean RLS and hazard rate of wild-type (h- 972) strain. Error bars: 95% C.I. on an exponential decay fit to the experimental survival curve. (C) Distribution of normalized doubling time in the five generations preceding death for Sir2p overexpression cells and (D) wild-type cells treated with 100 nM rapamycin. (E) Distribution of normalized length at division in the five generations preceding death for Sir2p overexpression cells and (F) wild-type cells treated with 100 nM rapamycin. Black bars show the median value. Sequential generations were compared using the Kolmogorov-Smirnov test (* for p<0.05, ** for p<0.01; n > 144 cells for all conditions).

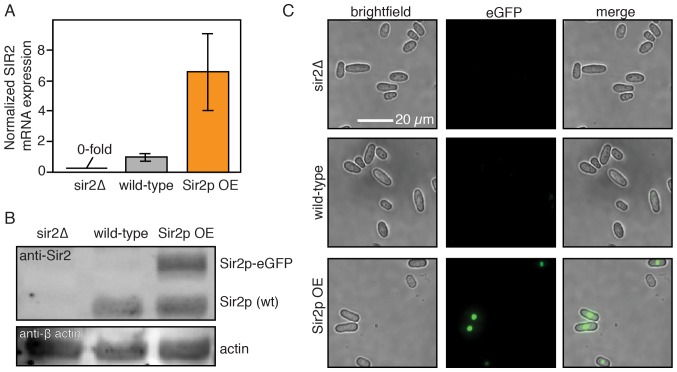
Figure 5—figure supplement 1. Sir2p expression levels.
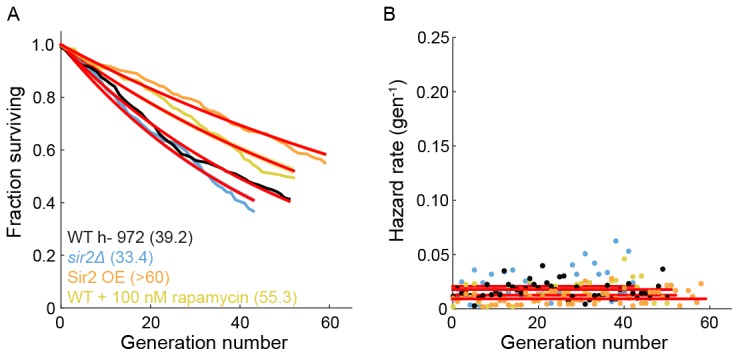
Figure 5—figure supplement 2. The effect of Sir2p and rapamycin on the RLS of fission yeast.


