. 2017 Jan 31;6:e20340. doi: 10.7554/eLife.20340

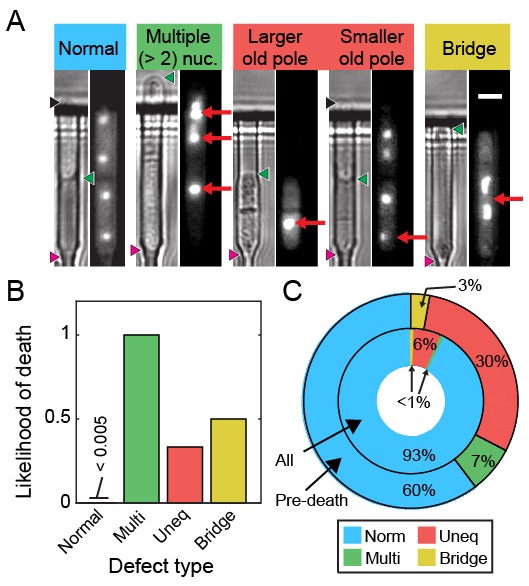
Figure 6. Ribosomal DNA (rDNA) instability is highly correlated with cell death.

(A) Images of cells exhibiting rDNA instability, as reported by gar2-mCherry, which binds to rDNA. (B) Likelihood of cell death following one of the defects observed in (A). (C) Dying cells exhibited elevated rDNA defects (outer ring) relative to healthy dividing cells (inner ring).
DOI: http://dx.doi.org/10.7554/eLife.20340.019

Figure 6.

Figure 6—figure supplement 1. Strains expressing gar2-mCherry maintain wild-type replication rates.
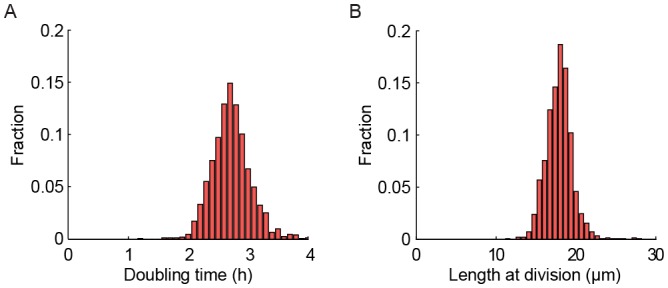
Figure 6—figure supplement 1.

(A) Histogram of doubling times of a strain expressing gar2-mCherry. The doubling time is 2.83 ± 0.87 hr (mean ± st. dev.; n = 1547). (B) Histogram of length at division. The length is 18.0 ± 2.3 µm (mean ± st. dev.; n = 1547).
Figure 6—figure supplement 2. Live imaging of chromosome mis-segregation rates.
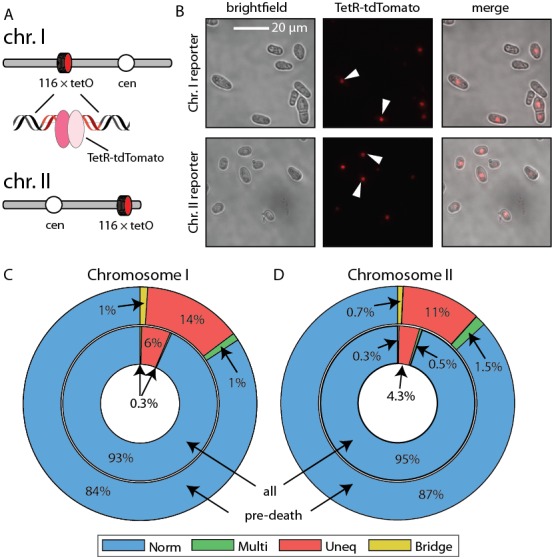
Figure 6—figure supplement 2.

(A) Chromosome loci were labeled with a 112-tetO repeat. TetR-tdTomato binds this array and allows live cell imaging of chromosome dynamics. Schematic adapted from Petrova et al. (2013). (B) Images of cells with chromosome I and chromosome II labeled with the tetO-TetR array. (C) Chromosome mis-segregation defects were characterized as in Figure 6. Norm: equal separation of fluorescent foci between siblings, Multi: multiple foci observed in single sibling, Uneq: unequal fluorescence between siblings, Bridge: foci remain connected post-division. Dying cells showed 2.3-fold elevated chromosome I and (D) 2.6-fold elevated chromosome II mis-segregation defects (outer ring) relative to healthy dividing cells (inner ring).
Figure 6—figure supplement 3. Characterization of the RLS of an rqh1Δ strain.

Figure 6—figure supplement 3.

(A) Survival curve of WT (black, 95% CI: 38.6–39.8 generations), rqh1Δ (green, 95% CI: 5.0–5.7), rqh1Δ + 100 nM rapamycin (blue, 95% CI: 6.2–7.2), and rqh1Δ sir2OE (orange). The extremely short lifetime of the rqh1Δ sir2OE strain precluded an accurate fit. (B) Hazard curves for the strains shown in (A). The number of cells, RLS, hazard rate, and goodness of fit parameters are summarized in Supplemental file 1. (C) The incidence of nucleolar defects for all divisions (center ring) and preceding death (outer ring) in rqh1Δ strain.