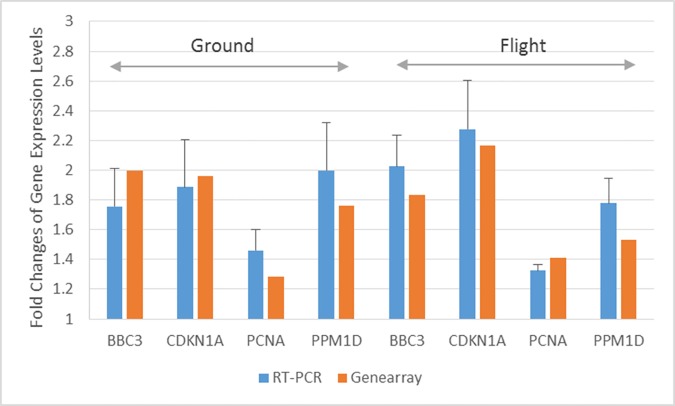
Fig 8. Comparison of fold changes of expressions of genes in Table 1 between microarray and PCR analysis in the flown and ground cells after bleomycin treatment.
Only significant changes (Fold > 1.3 and FDR<0.1 for microarray, and Fold >1.3 and P<0.05 for PCR array) are listed. BBC3, CDKN1A, PCNA and PPMID were the only genes up-regulated in all four cases.

