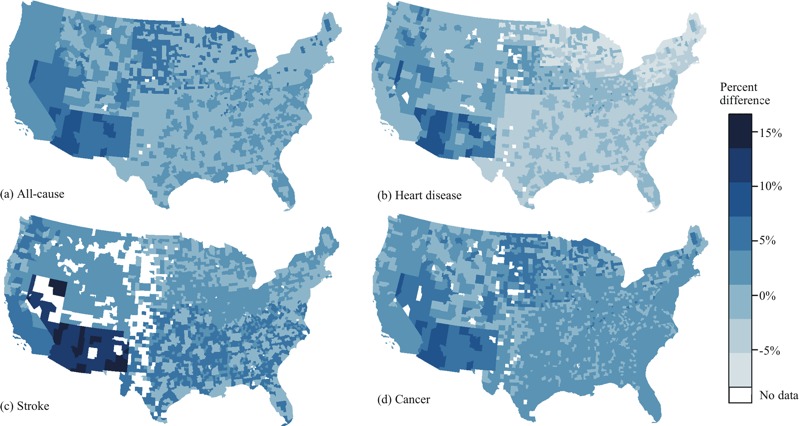
Figure 2.

Percent difference in all-cause (A), heart disease (B), stroke (C), and cancer (D) mortality rates for 2000–2005 per 1 standard deviation increase in the overall Envirnonmental Quality Index (EQI) estimated from the models clustered by Rural–Urban Continuum Code (RUCC)–climate combination. Maps were downloaded from the U.S. Census Bureau (2010; https://www.census.gov/geo/maps-data/data/tiger.html) and were reproduced using R (version 3.0.3; R Project for Statistical Computing).
