
Figure 3.
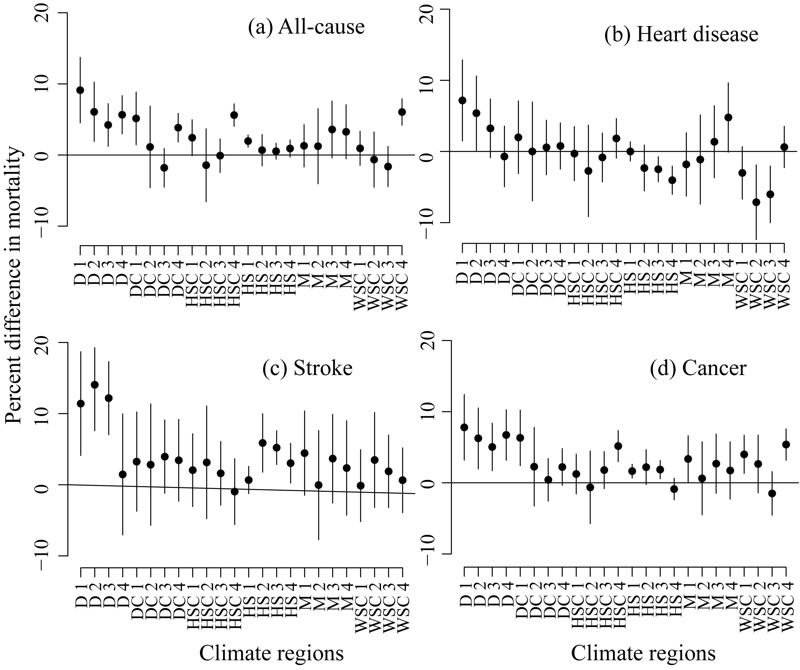
Percent difference (mean and 95% CI) in all-cause (A), heart disease (B), stroke (C), and cancer (D) mortality rates for 2000–2005 per 1 standard deviation increase in the overall Environmental Quality Index (EQI) estimated from the models clustered by Rural–Urban Climate Continuum (RUCC)–climate combination. Climate regions: dry (D), dry continental (DC), hot summer continental (HSC), humid subtropical (HS), Mediterranean (M), warm summer continental (WSC). The numbers 1–4 represent RUCC1 to RUCC4.