
Figure 3.
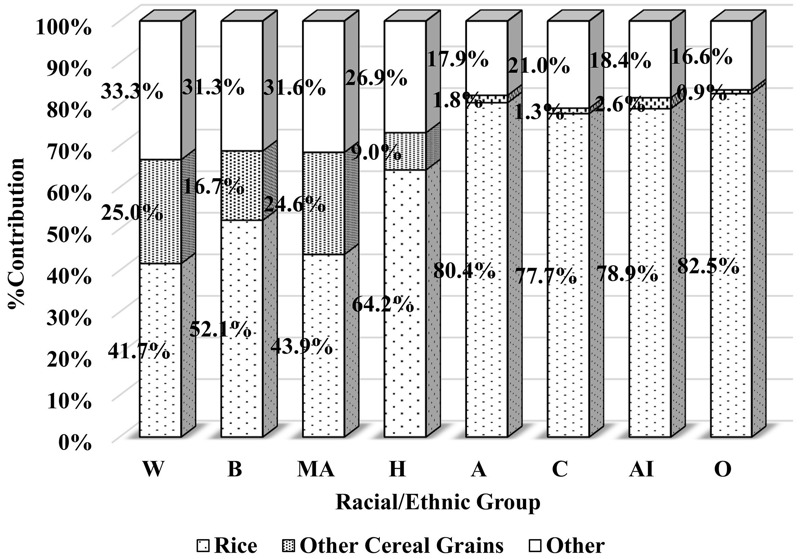
Food category–specific percent contribution to dietary arsenic (inorganic) intake by race/ethnicity. Legend: A, Asian; AI, Asian Indian; B, black; C, Chinese; H, other Hispanic; MA, Mexican American; O, Other Asian; W, white.
Official websites use .gov
A
.gov website belongs to an official
government organization in the United States.
Secure .gov websites use HTTPS
A lock (
) or https:// means you've safely
connected to the .gov website. Share sensitive
information only on official, secure websites.
Food category–specific percent contribution to dietary arsenic (inorganic) intake by race/ethnicity. Legend: A, Asian; AI, Asian Indian; B, black; C, Chinese; H, other Hispanic; MA, Mexican American; O, Other Asian; W, white.