Figure 5.

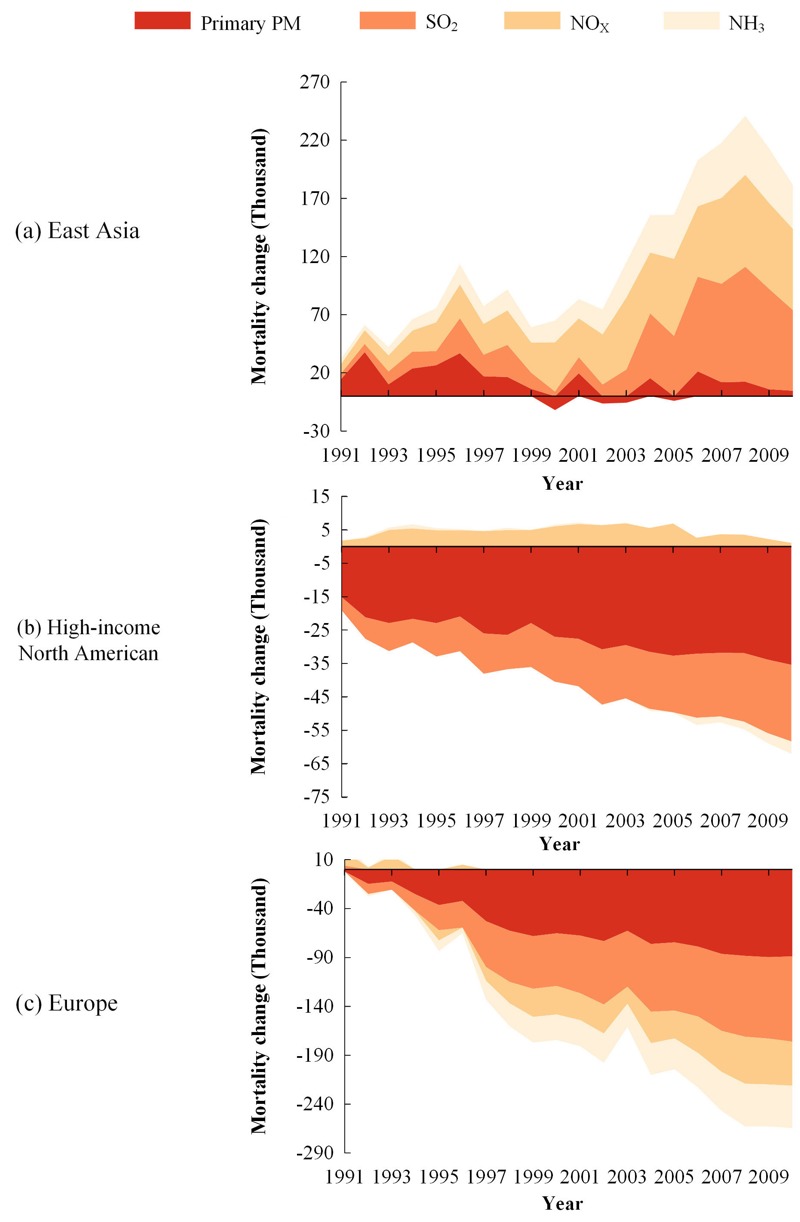
Estimated relative changes in PM2.5-mortality associated with changes in SO2, NOx, NH3,and primary PM emissions during 1991–2010 relative to the 1990 values.

Estimated relative changes in PM2.5-mortality associated with changes in SO2, NOx, NH3,and primary PM emissions during 1991–2010 relative to the 1990 values.